
I spent some time to characterize the performances of our astrometry determination algorithms (both meas_astrom and jointcal). In order to do so I have run a set of CFHTLS visits through processCcd using the Pan-STARRS reference catalog and then through jointcal in order to simultaneously align the exposures.
In order to characterize the quality of the astrometry determination, I take the first exposure as a reference and I match the others to the first one with afwTable.matchRaDec and I plot the distance (in mas) between the matched sources and the reference for both meas_astrom and jointcal. I select “good” not blended sources compatible with point-like stars and magnitude <20.
The first result is on a set of 6 visits (x36 CCD) spread over a 4 year time period (5-2005, 2-2006, 5-2006, 2-2007, 6-2007 and 6-2008).
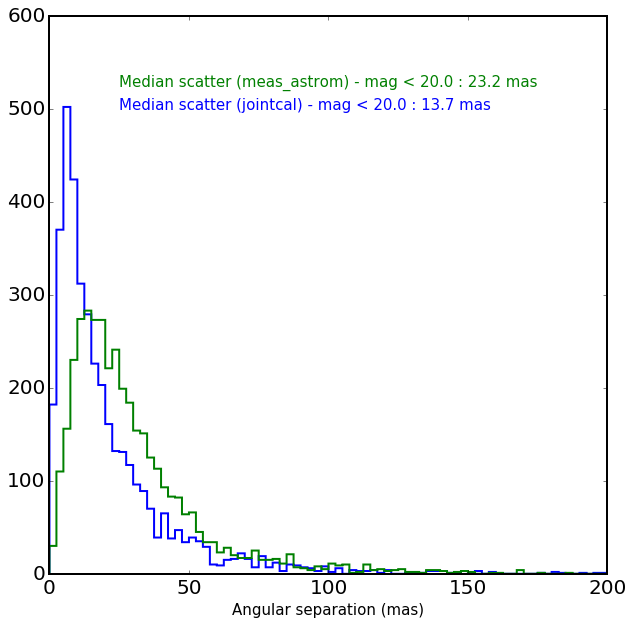
jointcal allows to shrink the median astrometric scatter from 23.2 to 13.7 mas.
Interestingly, if I look at the sources for which the scatter is greater than 50 mas (for jointcal) I am able to detect a few stars with proper motions. For instance, we can see in the second column of the following table that the angular separation between the source and the reference is increasing with time (the visits have been time ordered).
 id    dist  visit  ccdRef ccdVis   mag        ra          dec
---- ------- ------ ------ ------ ------- ------------ ------------
258 55.6089 838864     31     31 19.3011 214.92020944 52.277674711
258 72.3823 849375     31     31 19.3011 214.92020944 52.277674711
258 99.4688 895369     31     31 19.3011 214.92020944 52.277674711
258 130.413 918238     31     31 19.3011 214.92020944 52.277674711
258 190.957 996230     31     31 19.3011 214.92020944 52.277674711

525 55.1265 849375     33     33 18.1482 214.44795073 52.265735122
525  60.241 895369     33     33 18.1482 214.44795073 52.265735122
525 82.4524 918238     33     33 18.1482 214.44795073 52.265735122
525 113.678 996230     33     33 18.1482 214.44795073 52.265735122
In the second test, I am taking a set of 5 successive visits taken during the same night (2007-02-09)
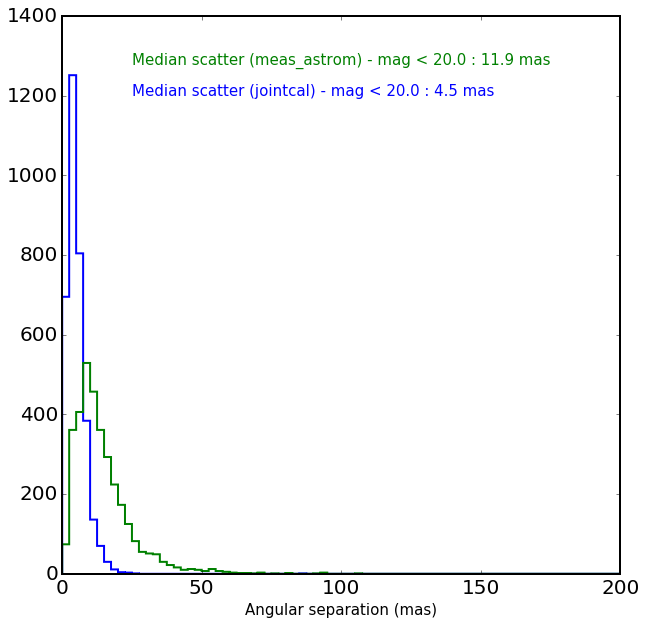
and this time we get 11.9 mas for meas_astrom and 4.5 for jointcal and of course I do not see any proper motion !
It tends to show that the focal plane / optics is not completely stable over a long period of time, but I don’t think that it is so surprising, I am even surprised that it is so stable !
As a final remark, it is clear that the many recent improvements that have been done in the astrometry algorithms and the availability of new reference catalogs have both considerably improved the quality of the image processing.