Rubin Seeing Band Distribution

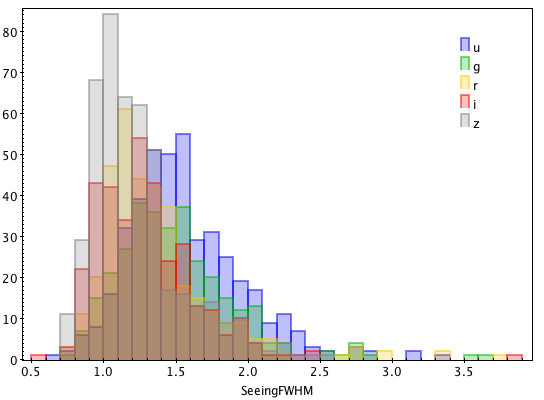
I am covering for someone (now on leave) who was preparing Rubin survey target files for image simulations of Euclid targets as observed by the Rubin Observatory LSST camera. I have attached a plot using the seeingFWHM column from survey files that were provided to us. There appears to be too many high values to be realistic for Rubin. I was hoping someone could have a look and let me know whether or not this looks correct?

RUBIN_SC8main_seeingFWHM_band_dist

Here is a picture extracted from the LSST Science Book (page 29). It is for a wavelength of 500 nm but it looks to me that the seeing FWHM distribution that you are using is shifted toward too high values.

Yes, thanks. that’s what we thought. We also consulted a similar plot in this paper https://iopscience.iop.org/article/10.3847/1538-4357/ab042c/pdf). We found that rescaling the seeing down by a factor 1.7 or 1.8 (depending on band) gave us the seeing distributions in the survey files with the same median (and similar scatter) to that discussed in this 2019 publication.