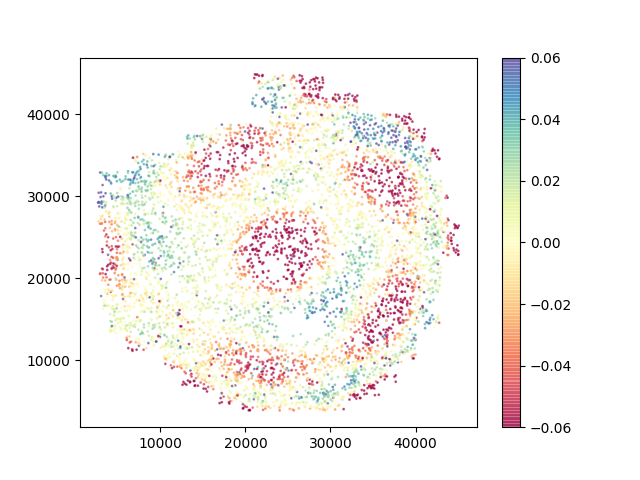
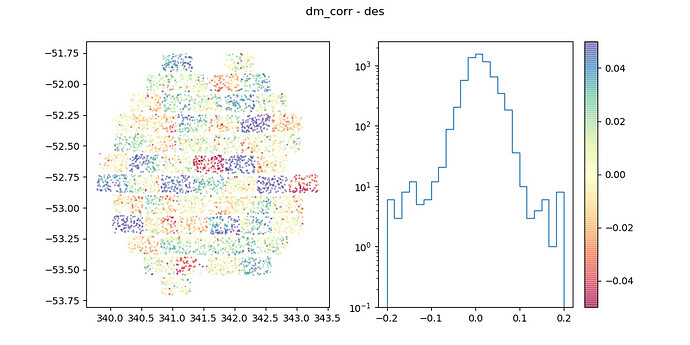
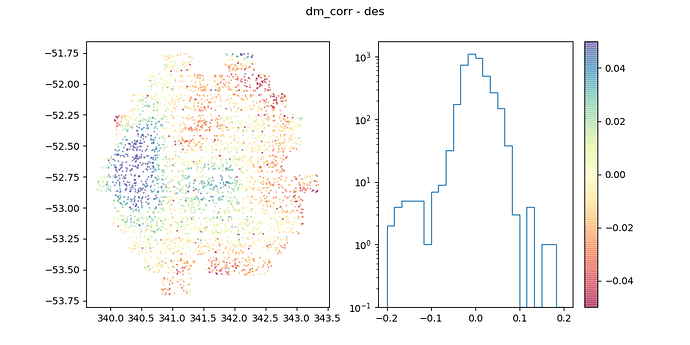
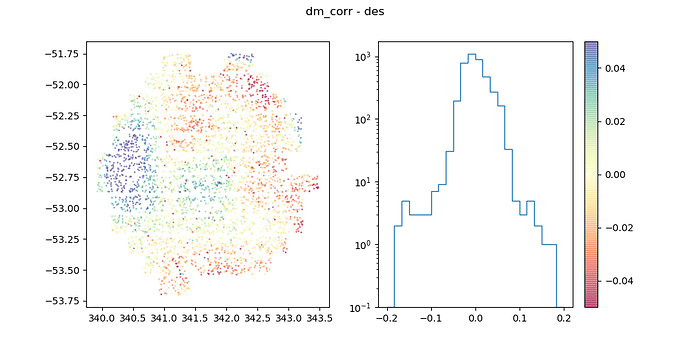
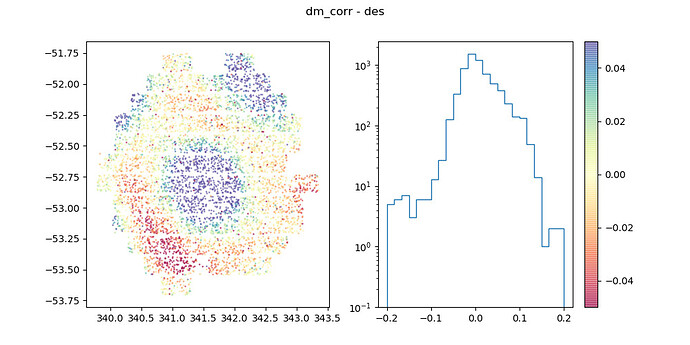
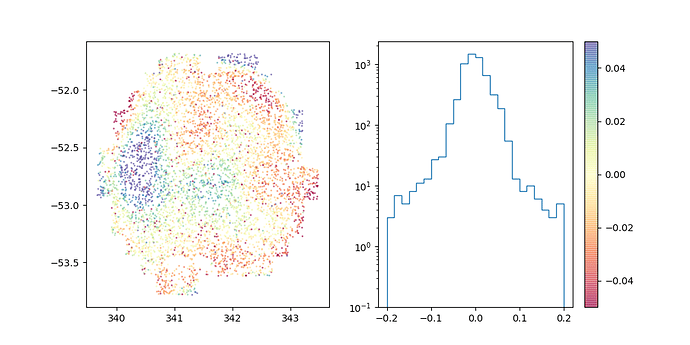
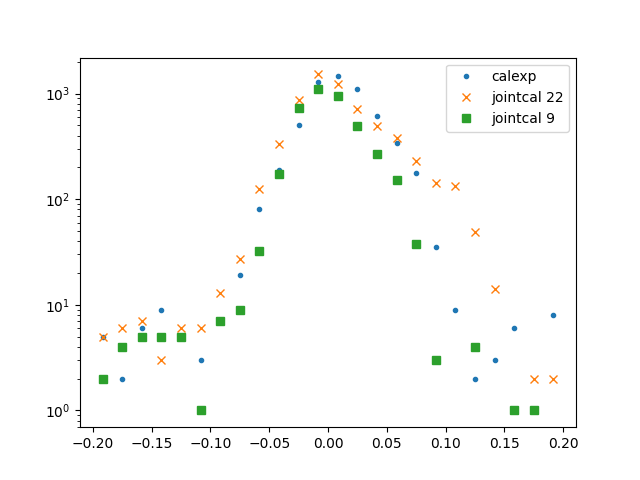
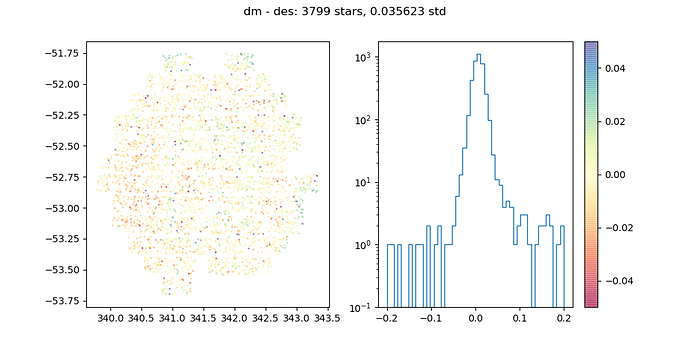
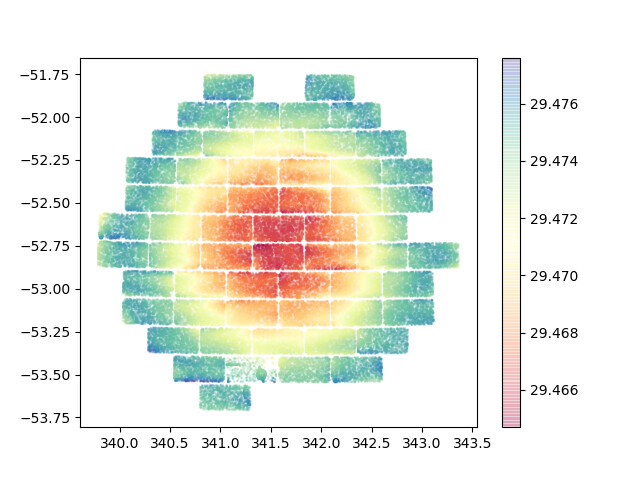
Dear all, we are using DM v19 to process some DECam data from raw, and compare the photometry (PSF mag) with DES. We use SkyMapper or PS1 (stars) as the photometric reference catalog, and Gaia as the astrometric reference catalog. The difference between the photometry of calexp_photocalib src from processCcd and DES looks random (Figure 1), but after running jointcal we found some pattern (Figure 2, 3 come from a dither group). The pattern is stronger in g and z-bands than r and i. This pattern changes with the number of input visits – if we use all archival data, we find some ring pattern (Figure 4), but it seems not from flat mastercals because it’s not centered and calexp doesn’t have this pattern. This pattern will propagate in coaddition steps and show up in the final coadd forced photometry catalog. (Figure 5)
We see similar patterns in other fields.
We wonder if anyone had seen similar pattern before. What should we do to avoid this, or is there any settings in jointcal we need to adjust (now we are mainly using the default config)? We appreciate any suggestions. Thank you.
Figures: the Figure 1-4 are DES mag - DM mag (with shift), the Figure 5 is DM - DES.
Figure 1: g-band visit 890702. The left panel shows the difference between calexp_photocalib src magnitudes and DES magnitudes (with a constant shift from color terms). The right panel is the histogram of the difference. We consider bright unsaturated stars between 16 and 20 magnitudes.
Figure 2: g-band visit 890702. We compare the jointcal_photocalib src magnitudes and DES. If we adjust wcs by jointcal_wcs, the result will be almost the same.
Figure 3: g-band visit 890703. Similar to Figure 2, we use jointcal_photocalib src magnitudes here. You can see how the pattern moves.
Figure 4: g-band visit 890702 but we use a larger set of visits in jointcal.
Figure 5: g-band forced photometry compared with DES. This is the result of the case showed in Figure 4.
