I’m posting a summary of some work on DCR in advance of the metrics
hack session on Thursday as I’m interested in developing a metric
related to DCR.
Please see
Most of this code was originally developed by Tina Peters (while a
postdoc at Toronto) and Bee Martin (undergrad at Drexel). However, we
no longer have the benefit of their time, so some help is both needed
and welcome.
The basic idea is this. Non-powerlaw spectral features can
significantly change the effective wavelength of the u and g
bandpasses, thereby shifting objects on the sky in those bands from
the position one expects from a source with a power-law SED with the
same color. Taking advantage of these offsets in SDSS data is
described in Kaczmarczik et al. (2009), developing on a method
originally suggested by David Schlegel.
LSST may or may not end up capturing DCR information in the same way
as SDSS (in the form of offsets relative to a fiducial bandpass).
Indeed it almost certainly will not. I claim that this doesn’t matter
for the sake of computing a metric. The information content is
ultimately the same whether we are talking positional offsets or
subband magnitudes (https://dmtn-037.lsst.io/).
So, what we are doing is looking at how the positional offset changes
with airmass. Specifically plotting the positional offset vs. tan Z
(where Z is the zenith angle) and computing the slope. Quasars at
different redshifts have different slopes as compared to quasars at
other redshfits (and from stars, galaxies, SNe, etc.). In principle
the metric doesn’t even need to refer to quasars at all – it can just
be computed relative to DCR slopes.
In practice, we take a simulated quasar with a known redshift (and
thus known slopes in the u and g bands). We then take observations
defined by some opSim and simulate changes to the sky positions for
each epoch (where higher airmasses give larger positional offsets).
We can add errors based on the magnitude of the sources and the
expected astrometric error at that magnitude. (A “to do” item is to
calculate the relationship between astrometric error and magnitude in
the u and g bands.)
We can then fit a line the the offset vs. tan Z distribution,
computing the slope (the intercept is fixed at 0 by definition) and
compare that measured slope with the “true” slope.
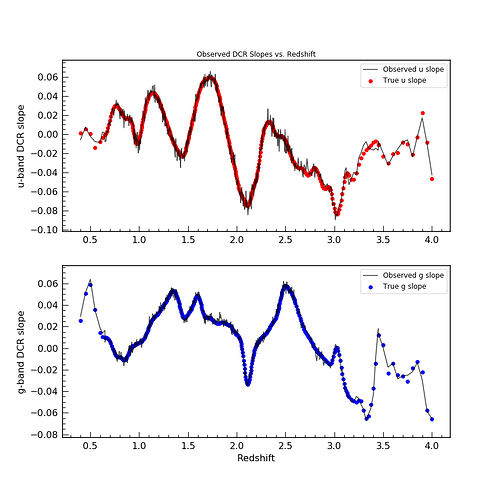
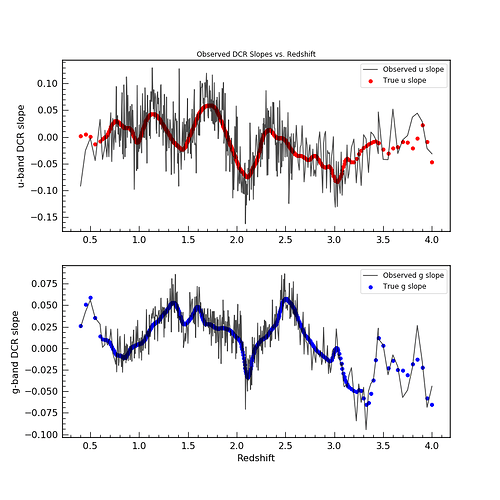
The first two plots show the result of such a simulation with 2
different sets of astrometric errors – simulating very bright objects
and fainter objects.
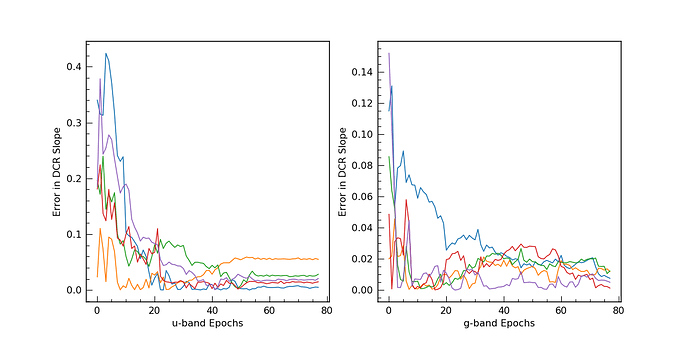
The next plot shows the improvement in the slope determination with
each added observation. From this it seems that nothing special is
needed to fully leverage DCR in LSST (that is there is no need for
twilight observations or high airmass observations). We make so many
observations (some of which end up naturally being higher airmass)
that the slopes are well constrained. However, different opSims will
have different airmass constraints and we should examine how this
impacts the information available from DCR by creating a formal metric.


